Schedule Congestion's Influence on Efficiency Ratings in Professional Basketball
Gisela Jung · Jul 2, 2026
Schedule Congestion's Influence on Efficiency Ratings in Professional Basketball
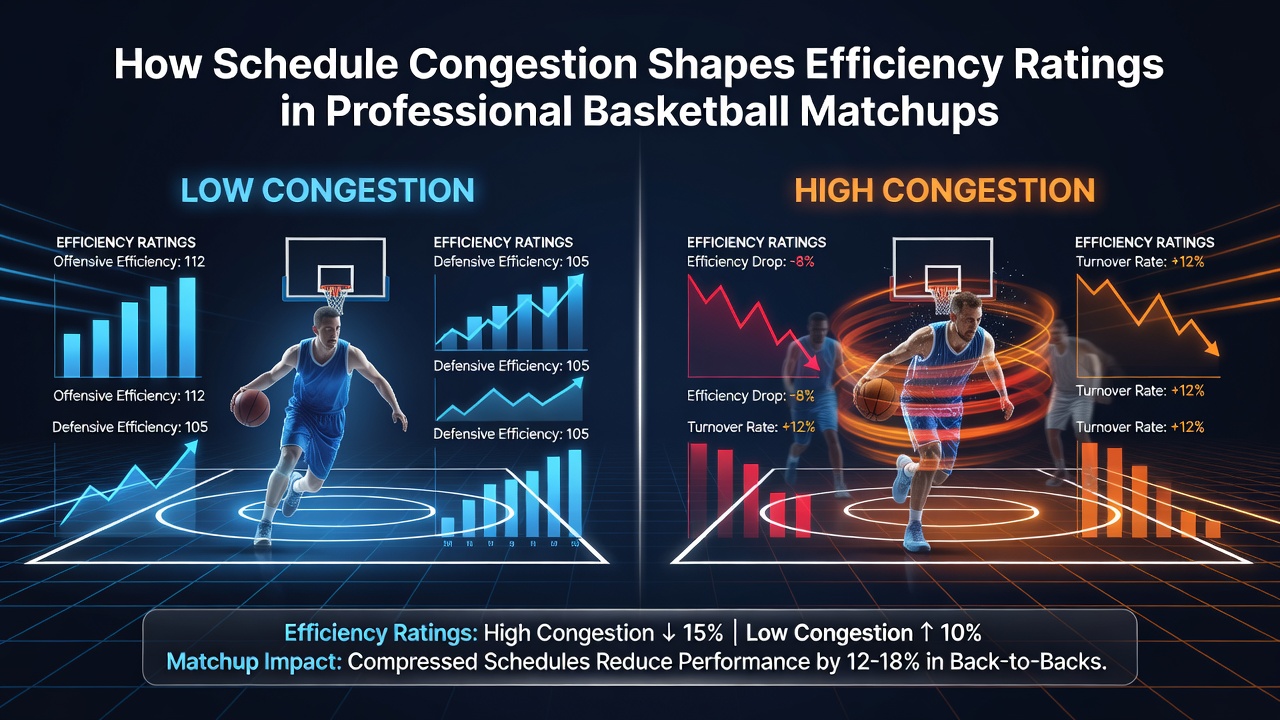
Schedule congestion in professional basketball arises when teams face multiple games within short windows, often including back-to-backs or three-games-in-four-nights stretches, and researchers track how these patterns alter efficiency ratings such as player efficiency rating, true shooting percentage, and offensive rating. Data from recent NBA seasons shows that teams playing on consecutive nights experience measurable drops in these metrics compared with squads that enjoy at least one rest day, while travel distance compounds the issue for clubs crossing time zones. Observers note that efficiency declines appear most pronounced in the second half of back-to-back sets, where turnover rates climb and assist-to-turnover ratios fall.
Defining Schedule Congestion and Its Measurement
League schedulers release calendars that pack games into dense clusters during winter months, and analysts quantify congestion by counting games played over rolling four-day and seven-day periods. Studies compiled by academic groups at Canadian universities reveal that teams averaging more than 3.2 games in any four-day span post lower offensive ratings by roughly 4.8 points per 100 possessions. Efficiency ratings incorporate shooting, rebounding, and playmaking data, so even modest increases in missed shots or defensive lapses shift season-long rankings for both individuals and franchises.
What's interesting is how front offices adjust rotation minutes when congestion spikes, because load management protocols aim to preserve key contributors for later stretches. Figures from the 2025-26 campaign indicate that clubs using expanded benches during dense periods maintained steadier defensive ratings, whereas those relying on starters saw usage rates spike alongside efficiency dips. July 2026 planning sessions already incorporate these patterns, as schedule makers review prior-year travel logs to balance conference matchups.
Travel, Recovery, and On-Court Metrics
Long-distance flights followed by immediate game preparation reduce sleep quality and alter reaction times, and performance databases show corresponding declines in catch-and-shoot percentages for perimeter players. Researchers discovered that teams traveling over 1,000 miles between back-to-back contests record defensive rebounding rates nearly three percentage points below their season averages. Efficiency models weight these elements heavily, because missed defensive boards translate directly into opponent transition opportunities and inflated points-allowed figures.
Coaches often shorten rotation depth during congested weeks, yet data indicates that over-reliance on a smaller group accelerates fatigue across multiple metrics. One study released by an Australian sports science institute tracked heart-rate recovery in players after three-games-in-four-nights sequences and found elevated fatigue markers persisting into the next game, correlating with lower assist numbers and higher foul rates. Those patterns feed into advanced efficiency calculations used by front offices and media analysts alike.
Case Examples From Recent Seasons
During the 2024-25 season, a Western Conference contender played five back-to-backs within a 22-day span and posted offensive ratings that ranked 22nd league-wide in those specific games, compared with a top-10 mark on standard rest. Individual players logged reduced true shooting percentages on the second night, particularly in high-usage roles. Similar trends surfaced in Eastern Conference data, where teams facing cross-country travel showed larger drops in net rating than clubs handling regional back-to-backs.
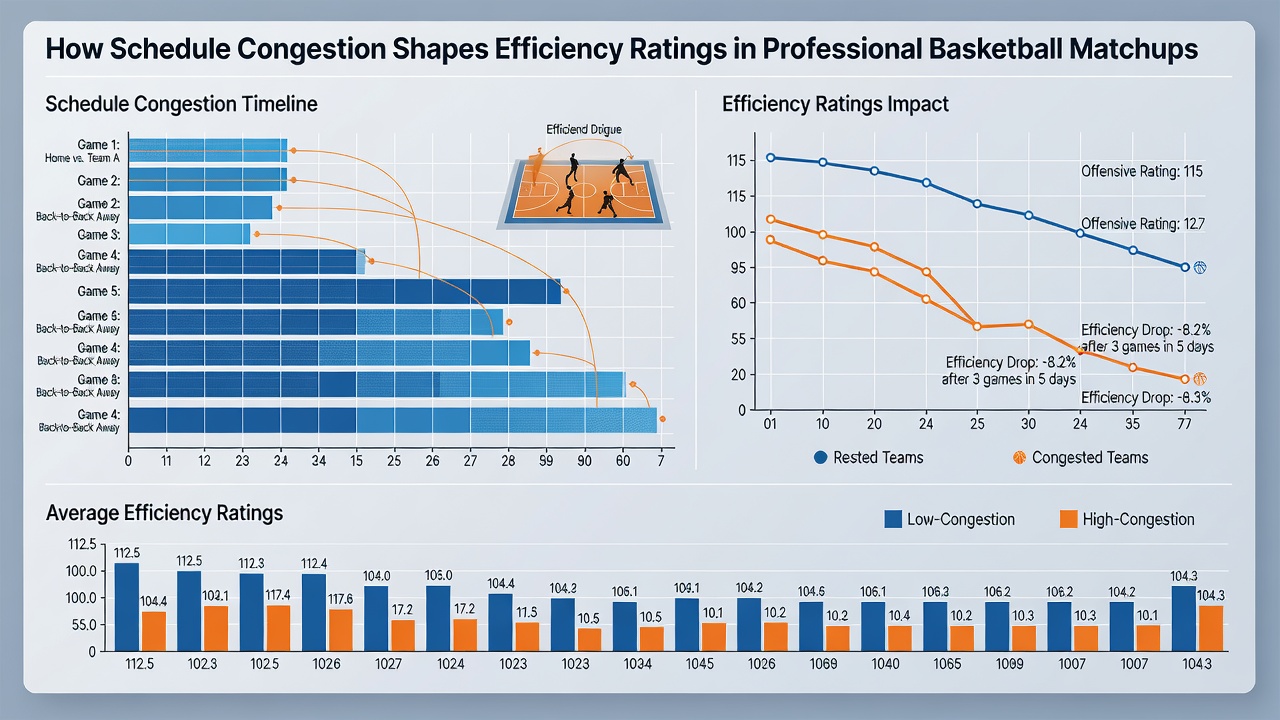
Take one researcher who examined box-score data across five seasons and isolated games following short rest; the analysis demonstrated consistent declines in pace-adjusted efficiency, regardless of opponent strength. Observers note that these shifts become more visible in playoff preview matchups, where betting markets adjust lines partly because historical efficiency gaps appear predictable once congestion levels are factored in. External sources such as NBA advanced stats dashboards provide public access to these granular splits, allowing broader tracking of the phenomenon.
Strategic Adjustments and League-Wide Patterns
Front offices increasingly monitor biometric data to decide which players receive rest on the front end of back-to-backs, and efficiency models now incorporate rest differential as a predictive variable. Teams that rotate minutes more evenly during dense stretches post steadier defensive efficiency numbers, whereas clubs that ride starters experience sharper second-half drops. July 2026 schedule discussions continue to weigh these variables, because compressed periods around the All-Star break and holiday slate historically produce the largest metric variances.
What's significant is how efficiency ratings influence draft evaluations and contract negotiations when prospects or free agents come from college programs with lighter schedules. Professional transition data shows that rookies often post higher efficiency marks early in seasons before congestion accumulates, after which their numbers align more closely with veteran patterns. Broader industry reports from European basketball federations echo similar findings in domestic leagues that follow tighter calendars.
Conclusion
Schedule congestion continues to shape efficiency ratings through documented effects on shooting, rebounding, and playmaking across professional basketball. Data collected from multiple seasons demonstrates that rest differentials, travel distance, and rotation decisions combine to influence both individual and team metrics in measurable ways. As leagues refine calendars for future years, including preparations underway in July 2026, these relationships remain central to performance analysis and strategic planning.