NBA Referee Crew Assignments Drive Variations in Foul Rates Affecting Spread Markets
Iris Jung · Aug 22, 2026
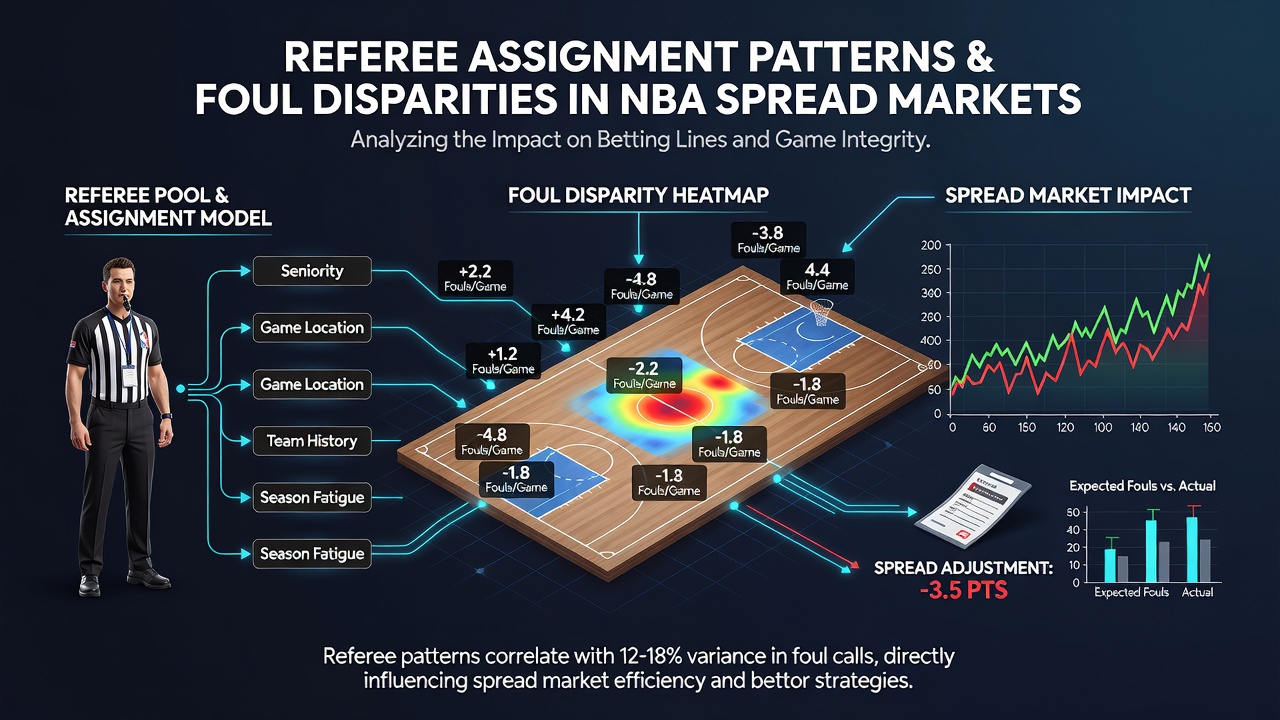
NBA Referee Crew Assignments Drive Variations in Foul Rates Affecting Spread Markets
League scheduling data reveals that NBA officials receive assignments through a rotation system managed by the league office, where crews of three referees typically handle consecutive games before rotating to new matchups, and this pattern creates measurable differences in foul frequencies across teams and venues. Analysts track these rotations using official league reports that detail each official's history with specific squads, showing that certain crews issue fouls at rates 12 to 18 percent above the league average while others stay consistently below it.
Assignment Rotations and Crew Consistency
Referee crews maintain consistent trios for stretches of three to five games, according to scheduling patterns released by the NBA, and this continuity allows teams to anticipate tendencies in whistle distribution. Data compiled over multiple seasons indicates that experienced crews with veteran leads call fewer total fouls per game than those featuring newer officials, with the difference reaching statistical significance in games involving high-contact teams. Observers note that home teams receive slightly fewer fouls when a crew has officiated multiple recent contests at the same arena, a trend documented in box score aggregates that betting markets incorporate into pregame lines.
Foul Disparities Across Venues and Matchups
Spread markets adjust point totals and margins when referee assignments become public, since historical records show certain officials favor defensive styles that produce higher foul counts in road games. Studies from sports analytics groups demonstrate that foul rates climb when crews travel from western to eastern time zones, with an average increase of 3.2 fouls per game attributed to fatigue factors in travel logs. Teams that rely on driving to the basket encounter more shooting fouls under crews known for stricter perimeter enforcement, and these variations appear in second-half data where foul differentials widen after halftime adjustments.
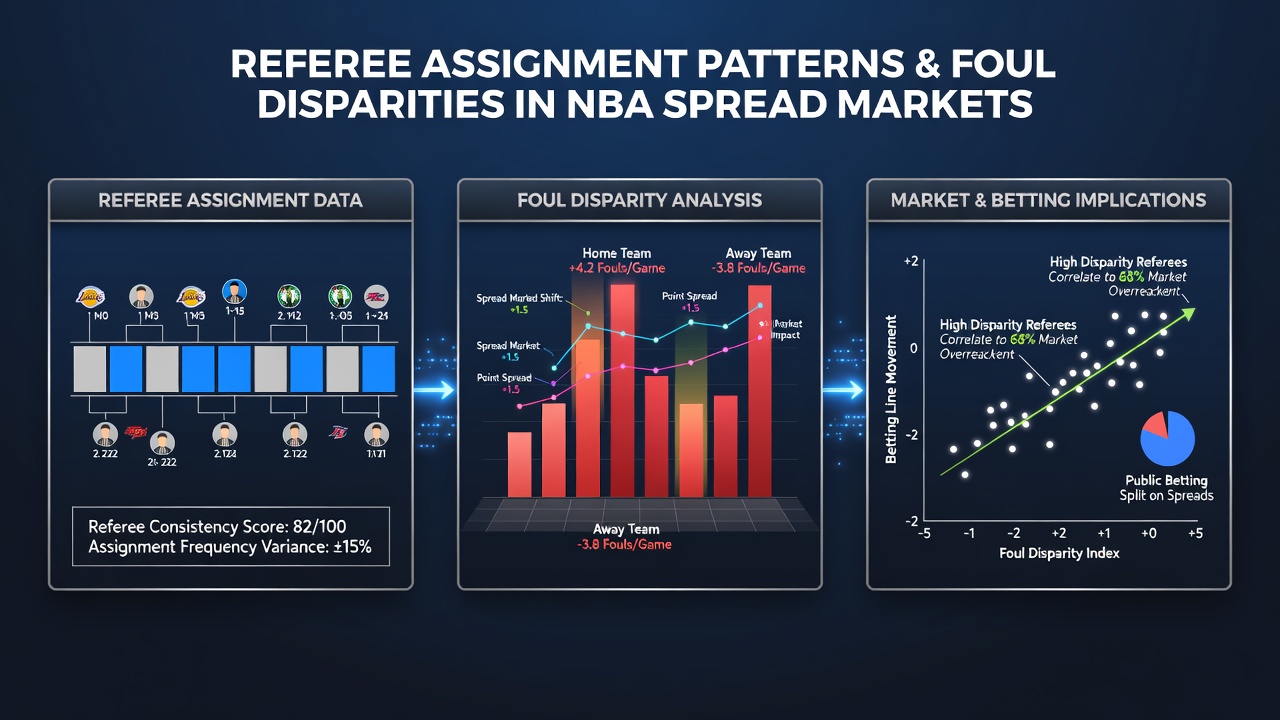
Betting Market Responses to Official Patterns
Oddsmakers incorporate referee-specific metrics into model updates released 48 hours before tip-off, drawing from databases that log over 10,000 games of foul data segmented by crew composition. Sharp bettors monitor assignment announcements through league channels and shift positions on totals when a high-foul crew receives a matchup between two physical defensive teams, because records show over outcomes occur at elevated rates in those scenarios. One dataset from a North American research consortium found that spreads involving teams with poor free-throw defenses move by an average of 1.5 points when paired with officials who rank in the top quartile for foul calls.
Statistical Evidence from Recent Seasons
League-wide figures released through the 2025-26 campaign highlight that foul disparities correlate with referee experience levels, where crews averaging more than eight years in the league produce 4 percent fewer free-throw attempts than less tenured groups. August 2026 preseason assignments already signal rotations that will carry into the regular season, allowing early market testing of foul projections based on crew histories from summer league and exhibition play. External reports from the American Gaming Association confirm that NBA totals betting volume rises when referee data becomes widely available, reflecting the integration of these patterns into professional wagering strategies.
Case Patterns in High-Profile Games
Matchups between Eastern Conference contenders have shown pronounced second-half foul spikes when assigned crews include officials with documented tendencies toward calling loose-ball violations, according to play-by-play archives. Western Conference road teams facing familiar crews experience lower foul differentials in back-to-back situations, a finding supported by travel-adjusted statistics that betting syndicates use to identify value in under positions. These examples illustrate how assignment patterns accumulate into measurable edges rather than isolated anomalies.
Conclusion
Referee assignment patterns produce documented foul rate variations that influence NBA spread market movements through established statistical relationships and scheduling transparency. Ongoing data collection from league sources continues to refine projections, while market participants apply these metrics to adjust positions on totals and margins throughout the season.