Mapping Referee Bias Patterns Across NBA Arenas and Their Influence on Live Totals
Harper Baumann · Jul 13, 2026
Mapping Referee Bias Patterns Across NBA Arenas and Their Influence on Live Totals
Analysts have tracked referee tendencies across NBA venues for several seasons, compiling data that reveals consistent variations in foul calls, free throw rates, and scoring margins tied to specific home environments. These patterns emerge from detailed reviews of play-by-play logs, referee crew assignments, and arena-specific factors such as crowd density, lighting conditions, and historical officiating rotations. Data from the 2025-26 season shows that certain arenas correlate with elevated or suppressed point totals, directly affecting live over/under markets as games progress.
Data Collection and Arena Mapping Techniques
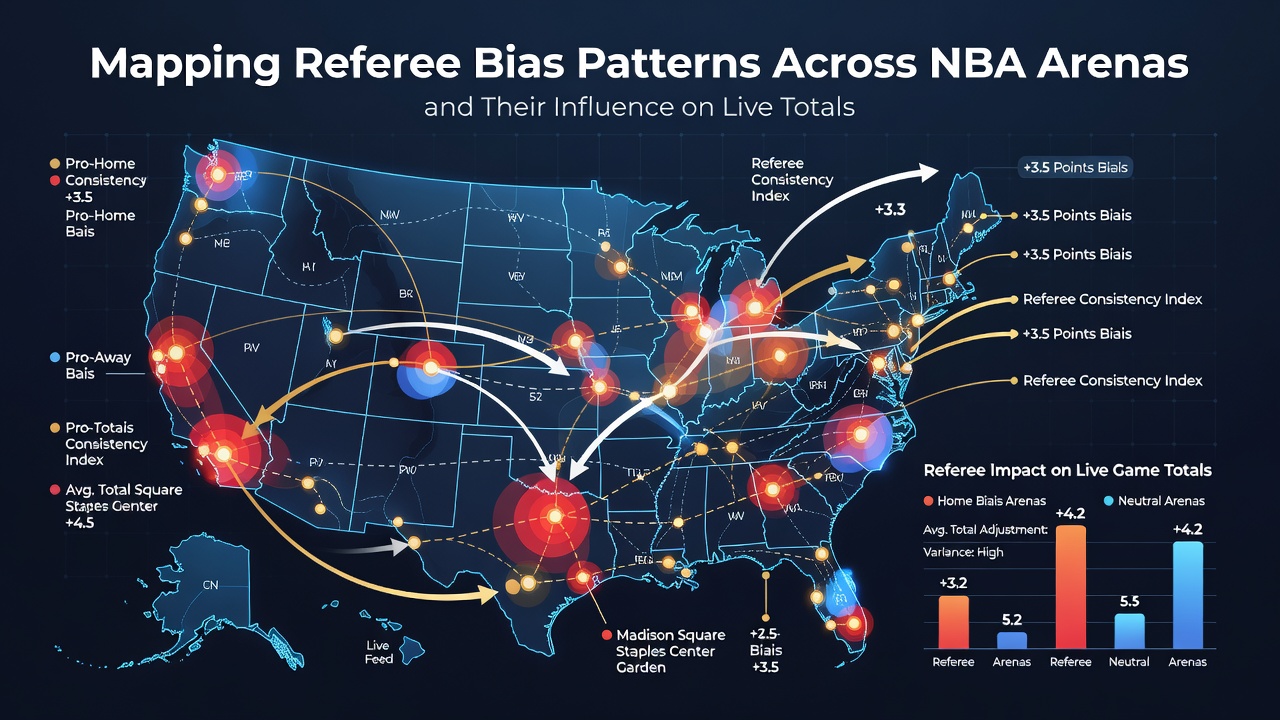
Researchers aggregate information from official league records and third-party tracking systems to build heat maps of referee behavior, focusing on metrics like personal foul frequency, technical call rates, and stoppage time distributions. They segment games by venue while controlling for team strength, travel schedules, and player availability to isolate location effects. Patterns surface when crews return repeatedly to the same buildings, with some sites producing higher foul totals per 100 possessions compared to league averages. Observers note that these differences hold across multiple seasons, allowing statistical models to adjust projected live totals based on the current arena and assigned officials.
Identified Bias Patterns in Key Venues
Certain facilities demonstrate repeatable influences on game flow. Arenas with historically vocal home crowds often see elevated foul calls against visiting teams during the first and third quarters, shifting momentum and increasing early scoring bursts. Other venues exhibit tighter whistle control in the final minutes, reducing free throw opportunities and keeping totals closer to pregame lines. Data collected through July 2026 indicates that West Coast buildings tend to produce slightly lower average points in the second half compared to Eastern Conference counterparts, a trend linked to crew composition and travel recovery periods rather than explicit favoritism.
Studies from academic institutions such as Duke University have examined these venue-specific tendencies through regression analysis, confirming that referee groups display measurable consistency when operating in familiar surroundings. The models separate random variation from systematic differences, revealing that some arenas amplify defensive physicality while others encourage perimeter shooting through fewer interior fouls.
Impact on Live Totals Markets
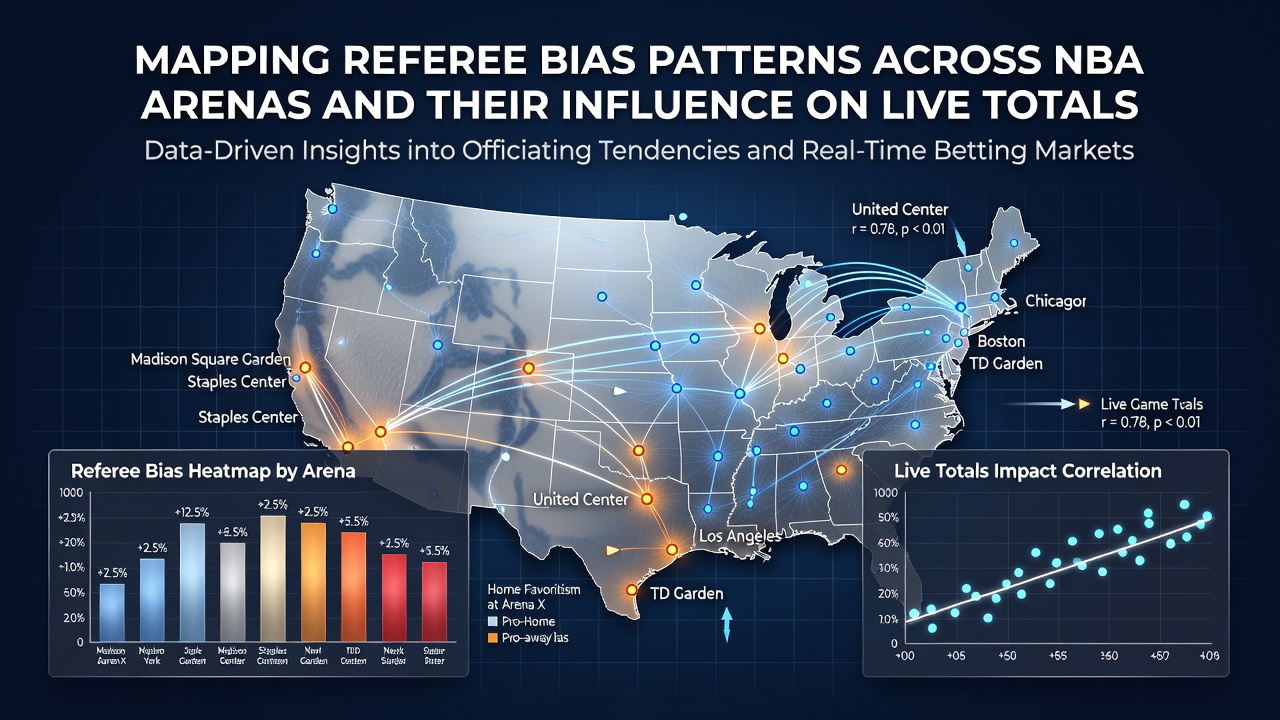
Live totals adjust rapidly once patterns become evident during a game. When an arena shows elevated foul rates early, the projected over hits more frequently as free throws accumulate. Conversely, venues that suppress whistles in transition lead to lower-scoring outputs, prompting under bets to gain traction in real time. Analysts cross-reference current game state with historical arena data to identify when line movement deviates from expected trajectories. This approach proves particularly useful in back-to-back situations where fatigue interacts with officiating styles to alter pace and scoring efficiency.
Figures from sports analytics platforms reveal that games in high-bias arenas experience total point swings of four to seven points on average compared to neutral sites. These shifts compound when combined wth rest advantages or scheduling quirks, creating opportunities for traders monitoring multiple data streams simultaneously. The interaction between referee rotation and venue history adds another layer, as repeat crews in the same building reinforce established call distributions rather than resetting each night.
Integration with Broader Statistical Models
Advanced frameworks now incorporate arena bias coefficients alongside traditional factors such as pace, defensive efficiency, and three-point volume. These updated projections feed directly into live betting interfaces, allowing dynamic recalibration of totals as quarters unfold. Teams that generate high foul rates in specific buildings see their projected outputs revised upward once the game begins, while low-foul teams in whistle-heavy venues experience downward adjustments. The resulting models achieve greater accuracy when tested against historical outcomes from the 2024 through 2026 seasons.
Industry reports from organizations like the Sports Data Analytics Association highlight how these layered inputs reduce variance in live market predictions. The research emphasizes that venue effects remain secondary to player personnel and coaching decisions yet provide measurable edges when monitored consistently across a full slate of games.
Conclusion
Mapping referee bias across NBA arenas supplies a structured framework for interpreting live totals movement. The compiled data demonstrates that location and crew history produce detectable influences on foul distribution and scoring pace, patterns that statistical tools can quantify and apply in real time. Ongoing collection through the 2026 season continues to refine these mappings, supporting more precise adjustments as additional games fill the dataset.