Geographic Demands and NBA Wagering Markets: Patterns Across Multiple Seasons
Gisela Jung · Aug 20, 2026
Geographic Demands and NBA Wagering Markets: Patterns Across Multiple Seasons
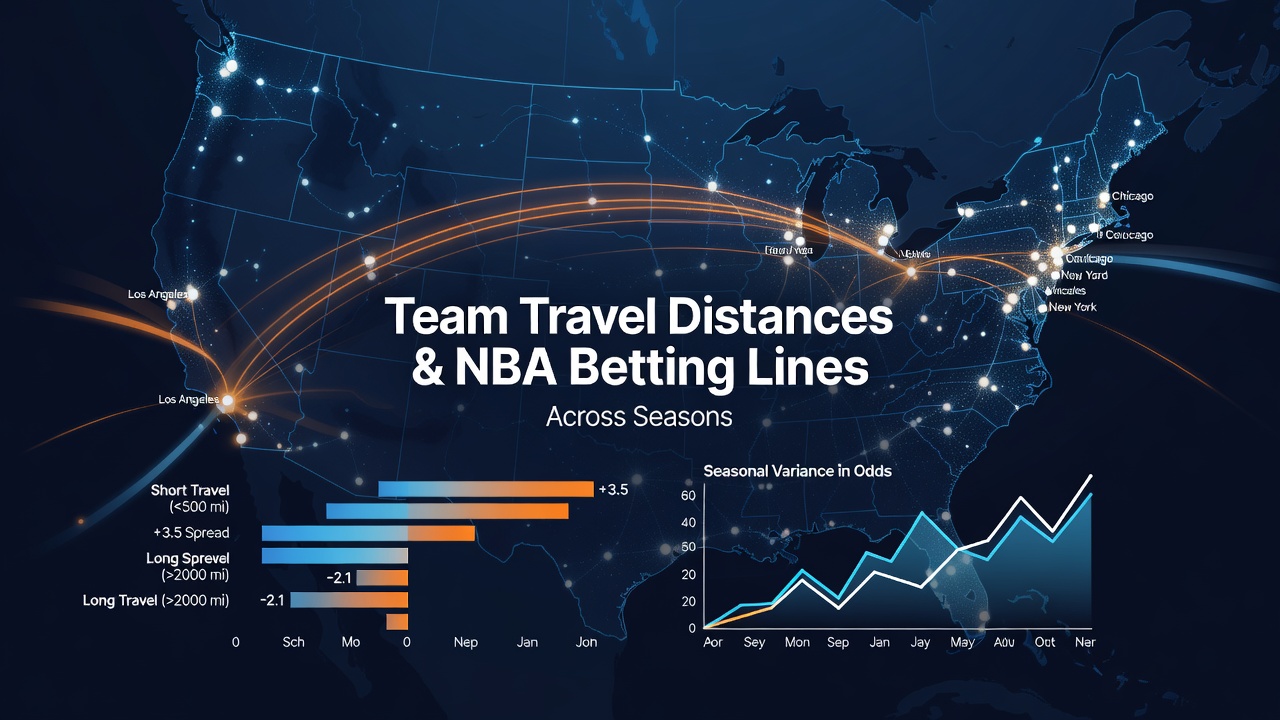
Teams in the NBA face extensive travel requirements each season, with cross-country trips, time zone shifts, and back-to-back games forming a regular part of the 82-game schedule, and researchers have tracked how these factors correlate with shifts in betting lines over time. Data from league schedules shows that Western Conference clubs often log more air miles than their Eastern counterparts, particularly during stretches that include multiple road games in different cities, and oddsmakers adjust point spreads and totals accordingly based on historical performance metrics.
Schedule Construction and Mileage Accumulation
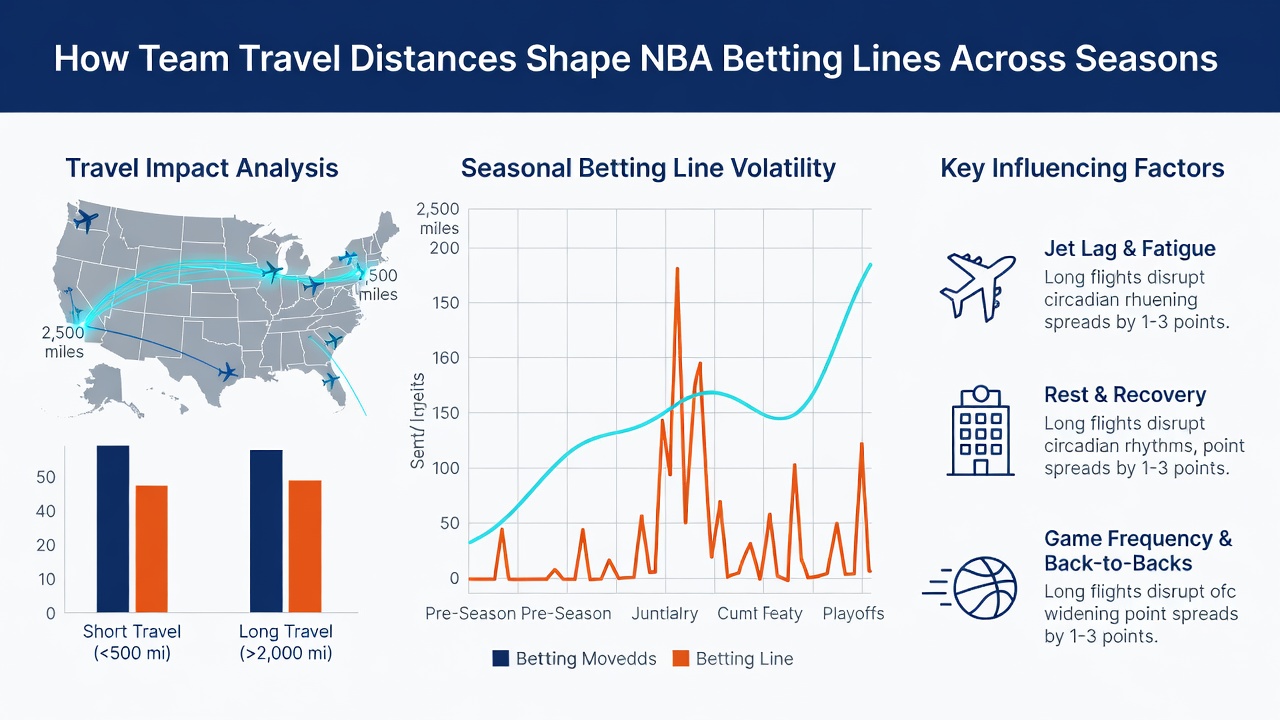
The NBA releases its schedule months in advance, with analysts noting that travel distances vary significantly between seasons due to changes in divisional alignments and arena availability, while studies of past campaigns reveal that teams averaging over 40,000 miles per season encounter measurable drops in scoring efficiency on the second night of back-to-backs. Observers note that Pacific Division squads, for instance, routinely travel farther to face Atlantic Division opponents, and betting markets reflect this through wider spreads when those teams arrive after long flights. Figures from recent seasons indicate that total team travel exceeds 1.2 million miles league-wide, with certain clubs accumulating substantially more based on their geographic position.
Performance Metrics Tied to Travel
Statistical reviews of game logs demonstrate that teams playing after crossing three or more time zones post lower field goal percentages in the first quarter compared to rested opponents, and this pattern holds across multiple seasons according to aggregated play-by-play data. Experts have observed that road teams in the second game of a back-to-back set cover the spread at rates below 48 percent in many years, prompting line makers to incorporate these tendencies when setting early odds. One study from a U.S. sports analytics group tracked outcomes from 2018 through 2025 and found consistent correlations between accumulated travel and reduced defensive rebounding rates, which in turn influences over/under totals in betting markets.
Oddsmaker Adjustments and Market Response
Betting lines evolve as schedules become public, with sportsbooks applying adjustments for teams facing heavy travel legs, and historical data reveals that spreads widen by an average of 1.5 points when a club arrives from a distant time zone. Researchers at academic institutions have examined how public bettors often overlook these factors, leading to line movements driven by sharp action that accounts for fatigue models, while industry reports from North American gaming associations highlight the integration of travel analytics into proprietary algorithms used by professional bettors. In August 2026, preparations for the upcoming campaign include refined scheduling software aimed at balancing mileage across conferences, and early indications suggest continued refinement of these models in wagering products.
Seasonal Variations and Conference Differences
Across seasons, Eastern Conference teams sometimes face shorter average travel distances during intra-conference play, whereas Western clubs encounter more variability, and this disparity appears in betting line distributions according to multi-year databases. Data indicates that totals trend lower in games involving teams with recent long-haul flights, particularly during January and February when schedules intensify, and observers have noted that these patterns persist even as teams adapt through improved recovery protocols. A Canadian research initiative compiled travel and outcome statistics that align with U.S. findings, showing similar impacts on three-point shooting accuracy after extended road trips.
Long-Term Trends in Wagering Data
Longitudinal analysis of betting records demonstrates that travel-related edges have remained relatively stable despite changes in league rules and player rest policies, with sharp bettors continuing to target specific scenarios involving cumulative fatigue. Figures reveal that certain franchises have improved their performance after heavy travel in recent years due to better conditioning programs, yet the overall market still prices these elements into opening lines each season. External sources such as official league tracking data and reports from the MIT Sloan Sports Analytics Conference provide detailed breakdowns that support these observations without relying on single-season anomalies.
Conclusion
Travel distances continue to factor into NBA performance statistics and subsequent betting line construction across seasons, with quantitative approaches allowing for ongoing evaluation of these influences as schedules and recovery methods evolve.