Distance and Disruption: Travel Schedules' Influence on Betting Lines in Nationwide Leagues
Iris Jung · Jul 20, 2026
Distance and Disruption: Travel Schedules' Influence on Betting Lines in Nationwide Leagues
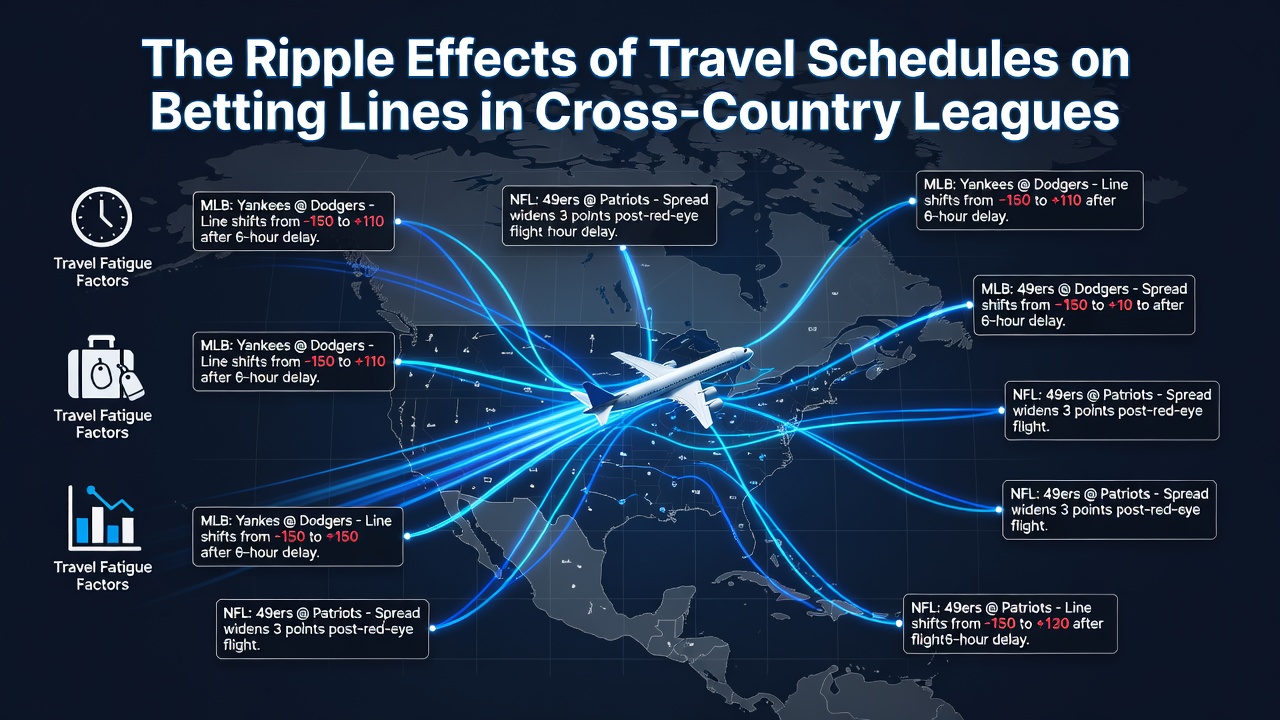
Travel across vast distances creates measurable shifts in team performance that ripple through betting markets for leagues spanning entire continents. In competitions such as the NBA, NFL, and MLB, schedules force squads to cover thousands of miles between games, and those movements correlate with changes in point spreads, totals, and moneyline odds. Observers note that bookmakers adjust lines based on historical data showing fatigue patterns, though the adjustments vary by sport and season phase. Data from multiple seasons reveals that teams playing on the second night of back-to-back road games after crossing time zones post reduced scoring margins. Researchers tracking NBA contests between 2018 and 2025 found that squads traveling westward across two or more zones covered the spread at a lower rate than expected when facing rested opponents. Those patterns prompted oddsmakers to shade totals downward in affected matchups, particularly during January and February when schedules intensify.League-Specific Travel Dynamics
Each sport presents distinct travel challenges that affect betting lines differently. NFL teams typically fly shorter distances during the regular season yet still encounter weather and recovery issues on cross-country trips. Studies compiled by university sports science departments indicate that teams arriving from the opposite coast win at rates several percentage points below home favorites in primetime slots. Bookmakers respond by inflating home-team spreads by half a point to a full point in those situations, according to historical line movement records.
MLB schedules stretch across six months with frequent coast-to-coast swings, and pitchers crossing time zones show elevated walk rates in the first two innings of games. Analysts reviewing pitch-tracking data note that betting totals dip measurably in those early frames, prompting sharper bettors to target under plays before lines stabilize. The reality is that oddsmakers incorporate these tendencies into opening totals, especially during interleague play when travel distances increase.Statistical Evidence and Line Adjustments
Performance metrics collected across five seasons demonstrate that travel distance correlates with turnover rates and shooting efficiency. In the NBA, teams logging more than 2,500 miles in a seven-day window allow opponents to shoot 3.2 percent higher from beyond the arc on average. Betting markets reflect this through adjusted player props and team totals, with sportsbooks tightening limits on overs when multiple road teams appear on the same slate.
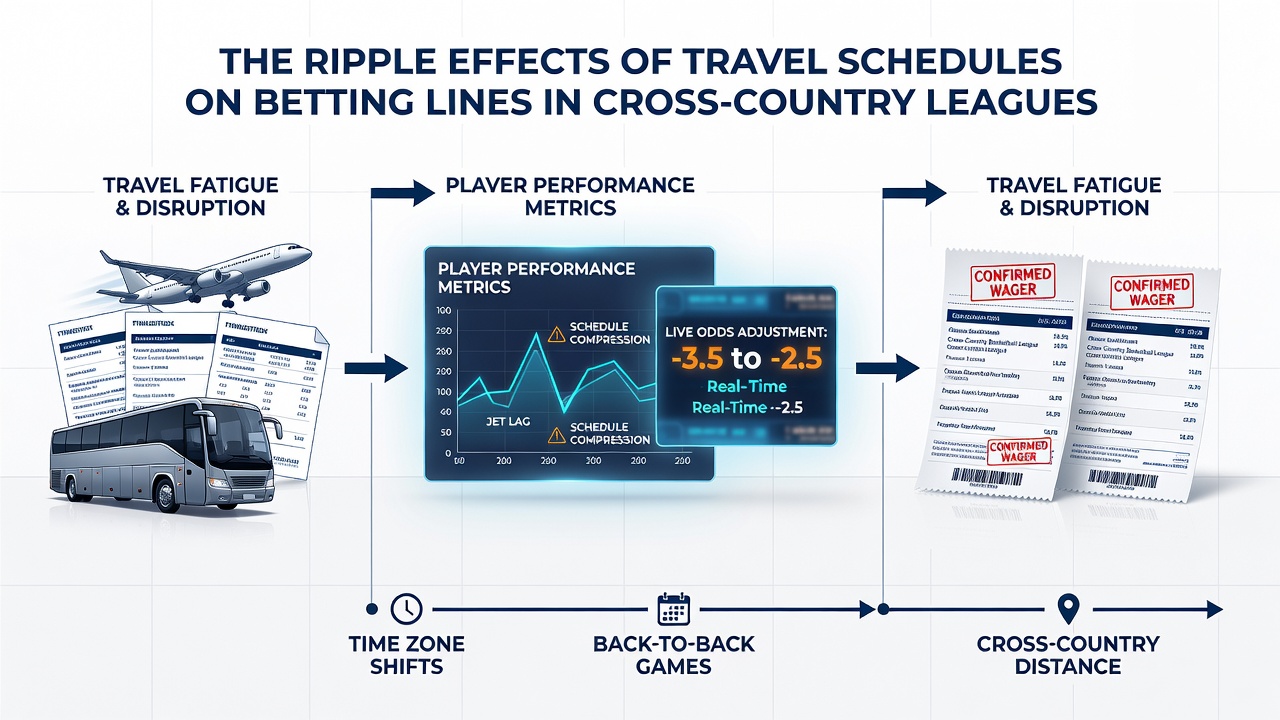 What's interesting is how these effects compound during compressed schedules. July 2026 marks the start of summer league preparations where front offices review prior-year travel data to plan roster depth; analysts expect similar patterns to emerge in the following regular season as expanded calendars add extra cross-country dates. Government statistical agencies in North America have published league-wide mileage reports that sportsbooks reference when setting early-season lines.
Market Reactions and Bettor Behavior
Sharp bettors monitor flight logs and recovery windows to identify discrepancies between public perception and actual performance edges. When a team completes a four-game road swing covering three time zones, line movement often favors the rested home side by an extra half point beyond standard home advantage. Industry reports from research institutions tracking wagering volume show that public bettors tend to overvalue recent results without accounting for cumulative travel load, creating pockets where contrarian positions hold value through the first half of games.
European and Australian sports governing bodies have released comparative studies on jet-lag mitigation protocols used in their domestic leagues; those findings occasionally inform North American teams preparing for international exhibitions. The adjustments appear in pregame totals rather than spreads in most documented cases.
Conclusion
Travel schedules continue to shape betting lines across cross-country leagues through documented performance variances. Leagues release updated mileage data each off-season, and oddsmakers integrate those figures into opening numbers while bettors refine models around recovery timelines. Patterns observed through 2026 indicate that distance remains a persistent variable in line construction for sports spanning multiple time zones.