Analyzing Pitcher Workload Trends and Late-Season MLB Totals
Cameron Berger · Jun 18, 2026
Analyzing Pitcher Workload Trends and Late-Season MLB Totals
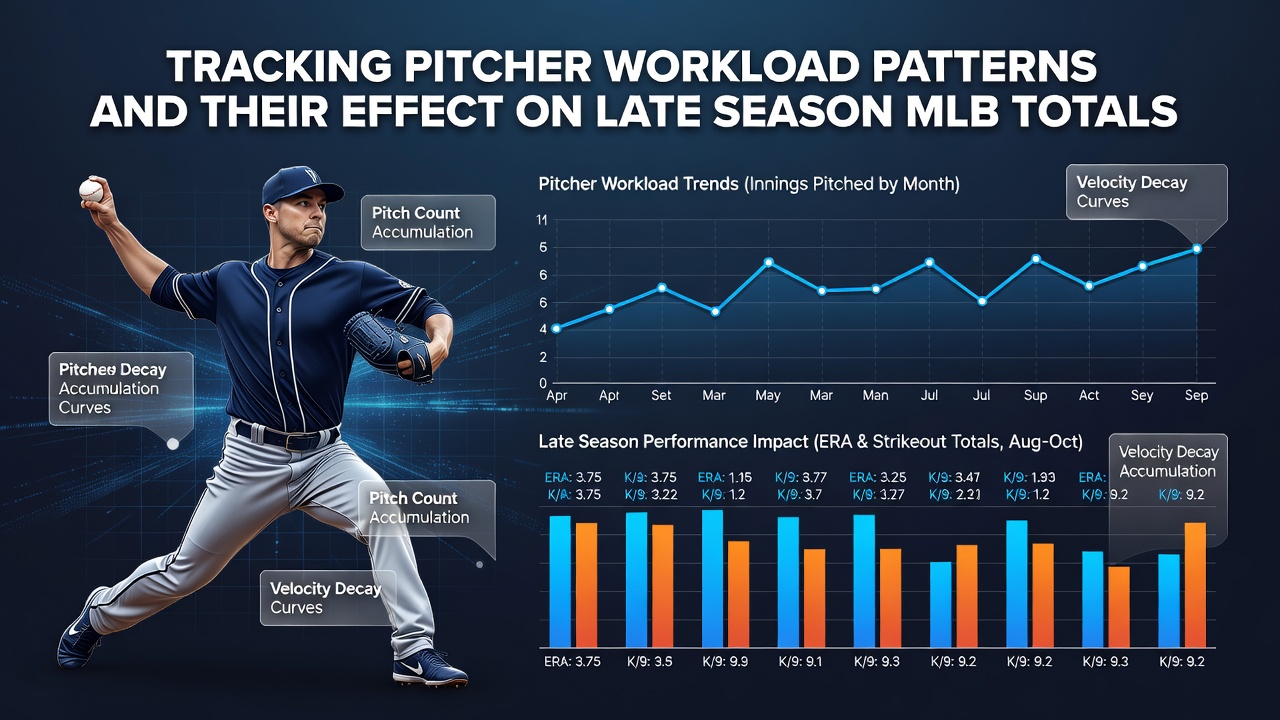
Teams across Major League Baseball track pitcher workloads through detailed metrics that include innings pitched, pitch counts per outing, days of rest between starts, and cumulative stress loads accumulated over months of competition, while these measurements help organizations manage arm health and performance consistency as the regular season progresses into its final months.
Data collection relies on integrated systems that combine radar tracking from Statcast with manual logging by coaching staffs, and analysts examine how spikes in high-pitch-count games during April and May correlate with diminished velocity or command later in the year. Research indicates that starters who exceed 100 pitches in multiple consecutive outings show measurable drops in strikeout rates by August and September, according to aggregated figures from multiple seasons.
Core Metrics Used in Workload Tracking
Front offices monitor several variables that together form a picture of cumulative fatigue, including total pitches thrown in a 30-day window, average fastball velocity trends, and recovery time measured through bullpen sessions. Organizations also factor in travel schedules and altitude effects, since these elements add physiological stress beyond raw pitch totals. Observers note that relievers face different patterns, with high-leverage appearances often clustered in short bursts that require separate recovery protocols from those applied to rotation members.
Studies compiled by sports analytics groups reveal that pitchers logging more than 180 innings by the All-Star break experience a higher incidence of reduced effectiveness in the final 50 games. These patterns hold across both starting pitchers and multi-inning relievers, though the thresholds differ based on role and individual throwing mechanics.
Seasonal Shifts Observed in Recent Campaigns
By June 2026, several clubs have adjusted rotation construction after reviewing first-half data that linked elevated spring workloads to late-summer declines in quality starts. Teams now incorporate more tandem-starter arrangements early in the schedule to distribute innings more evenly, and this approach has produced measurable changes in September totals when offenses face fresher arms. Historical datasets show that divisions with stricter pitch-count enforcement in the first half tend to post lower run totals in divisional matchups during the stretch run.
What's interesting is how bullpen management intersects with these trends, because managers who limit high-leverage relievers to fewer than 25 pitches per appearance maintain better late-inning command through September. Data from recent seasons demonstrates that clubs following such guidelines see their team earned-run averages drop by roughly 0.40 runs in the final month compared with clubs that push those arms harder in June and July.
Connections to Over/Under Totals
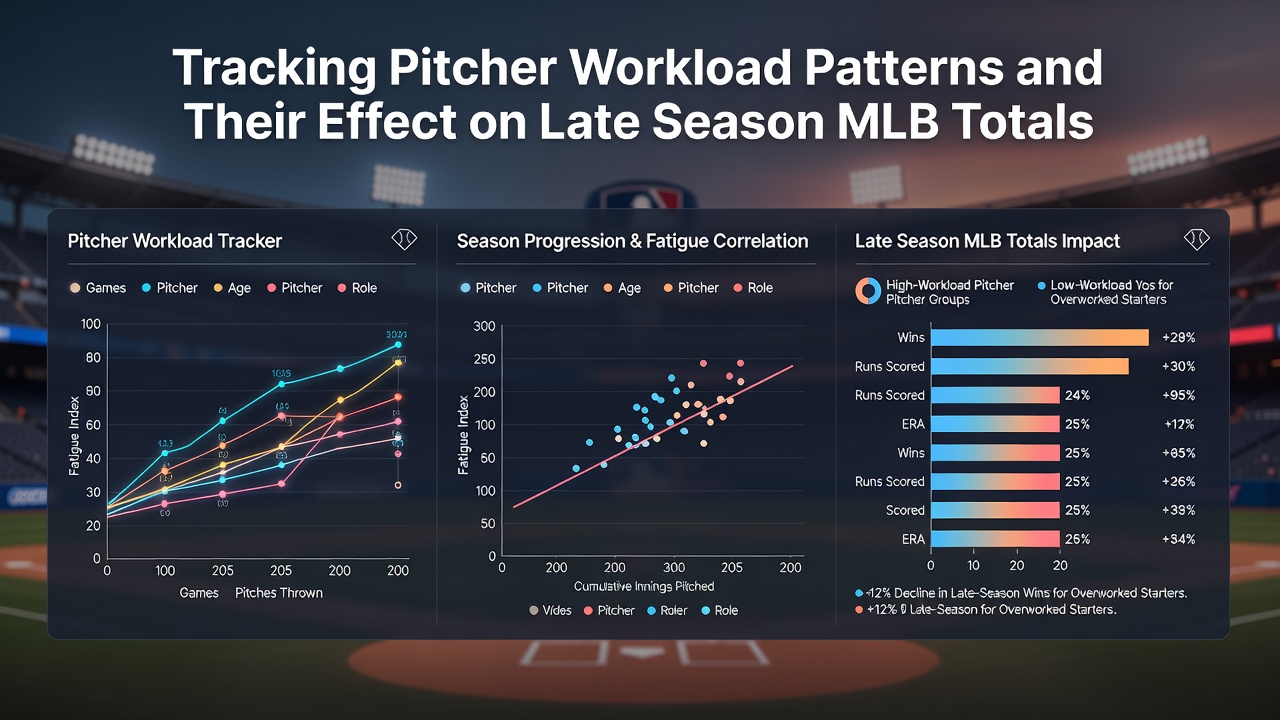
Late-season game totals often shift when opposing starters carry heavier cumulative workloads into matchups, and betting markets have adjusted lines accordingly once advanced metrics become public. Games featuring two pitchers each exceeding 150 innings pitched by late August have produced under results at a higher rate than league averages, while contests with at least one lightly used starter show the opposite movement. Analysts cross-reference these outcomes against park factors and weather data to isolate workload effects from environmental variables.
One study released by the FanGraphs research collective examined five years of September results and found that starters on reduced rest following heavy July usage surrendered more hard contact, directly influencing run totals. Another examination from Canadian sports analytics researchers at the University of Waterloo confirmed similar patterns when controlling for opponent quality and defensive support behind each pitcher.
Practical Applications Across Organizations
Coaching staffs now integrate workload dashboards into daily lineup decisions, and these tools flag when a starter's fastball velocity has declined more than two miles per hour from opening-week baselines. Such alerts prompt earlier hook decisions or skipped turns in the rotation, both of which alter expected run production in subsequent games. Teams that adopted these systems earliest recorded fewer blown leads in the eighth and ninth innings during 2025 and early 2026 campaigns.
Take one research group that tracked minor-league call-ups who entered the majors with lighter first-half workloads, those pitchers posted higher strikeout-to-walk ratios in September than peers who had logged heavier minor-league innings. The difference illustrates how prior usage patterns carry forward even after a player changes levels.
Conclusion
Workload tracking has evolved into a central component of roster construction and in-season adjustments, with measurable effects on late-season performance metrics that include run totals and game outcomes. Organizations continue refining their models by incorporating new sensor data and recovery markers, while analysts update projections each month to reflect observed correlations between early-season usage and September effectiveness. These ongoing refinements provide clearer frameworks for evaluating how cumulative pitcher stress shapes the final stretch of the regular season.